


Precision nutrient management
Non-CO₂ emissions refer to greenhouse gas (GHG) emissions and climate-forcing pollutants other than carbon dioxide (CO₂) that contribute significantly to the global warming footprint. These include methane (CH₄), nitrous oxide (N₂O), black carbon (BC), tropospheric ozone (O₃), and other fluorinated gases such as hydrofluorocarbons (HFCs).
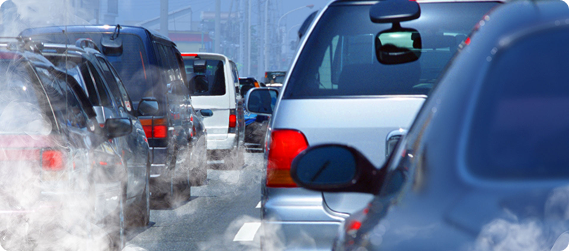
Although many of these pollutants have shorter atmospheric lifetimes than CO₂ and are classified as short-lived climate pollutants (SLCPs), they possess much higher global warming potentials, making their mitigation critical for near-term climate benefits, as well as improved air quality and public health gains.

Did you know?
Collectively, they contribute approximately 45% of current global warming and, in addition, exacerbate air pollution, accelerate glacier melt, increase public health risks, and cause substantial crop yield losses, along with other environmental and socio-economic impacts.
Did you know?
Collectively, they contribute approximately 45% of current global warming and, in addition, exacerbate air pollution, accelerate glacier melt, increase public health risks, and cause substantial crop yield losses, along with other environmental and socio-economic impacts.
Non-CO₂ emissions refer to greenhouse gas (GHG) emissions from climate-forcing pollutants other than carbon dioxide (CO₂) that contribute significantly to the global warming footprint. They contribute to approximately 45% of current global warming and, in addition, exacerbate air pollution, accelerate glacier melt, increase public health risks, and cause substantial crop yield losses, along with other environmental and socio-economic impacts. Short-lived climate pollutants (SLCPs) constitute a critical subset, characterised by short atmospheric residence times but high near-term warming influence. Thus, mitigating these pollutants are critical for near-term climate benefits, as well as improved air quality and public health gains.

Key emitters: Agricultural soils from synthetic fertiliser use, manure management, crop residues and biomass burning, wastewater treatment, landfills (decomposition of organic fraction), industrial production (nitric acid, adipic acid), fossil fuel and biomass combustion
GWP 20*
GWP 100*
Atmospheric Life span

Key emitters: Domestic and industrial wastewater treatment, enteric fermentation and manure management from livestock, rice cultivation, landfills (decomposition of organic fraction), crop residues and biomass burning, fugitive emissions from oil, gas and coal mining
GWP 20*
GWP 100*
Atmospheric Life span

Key emitters: Incomplete combustion of fossil fuels and biomass, including diesel engines (transport and generators), residential biomass use (cooking and heating), brick kilns and small industrial coal combustion, open burning of crop residues and solid waste.
GWP 20*
GWP 100*
Atmospheric Life span

Tropospheric ozone is a secondary air pollutant formed when volatile organic compounds (VOCs), methane, and nitrogen oxides (NOₓ) react in the presence of sunlight (photo-chemical reaction).
Key emitters: Power plants, transport, industrial and fuel combustion, solvent use, fertilizer application, livestock, biomass burning, and waste burning. Ozone formation is often intensified by high temperatures, especially in urban areas.
GWP 20
Atmospheric Life span

Key emitters: Residential and commercial refrigeration and air-conditioning, cold chain and food storage systems, mobile air-conditioning in vehicles, foam blowing agents in insulation and packing, fire suppression and aerosol applications, leakage during manufacturing, servicing and end-of life disposal
GWP 20*
GWP 100*
Atmospheric Life span
* - Global Warming Potential (GWP) is a metric developed by the Intergovernmental Panel on Climate Change (IPCC) to compare warming
impacts of different GHGs relative to CO₂ over a specific time horizon, typically 20 or 100 years.
Here, GWP 20 gives the warming potential over a 20 year horizon and GWP 100 gives the warming potential over a 100 year horizon.
** - GWP of most commonly used HFC

Long-term temperature stabilisation depends on sustained CO₂ reduction, while near-term climate outcomes are strongly driven by non-CO₂ mitigation

 Mitigation scope
Net warming
 Near-term effect (2030s)
Net cooling
Limited reduction, net cooling post-2050
Warming rate
~50% lower warming rate, immediate net cooling
~0.07°C by 2050
 Temperature rise avoided
~0.26°C by 2050
Crossed (~2045-46)
 2°C Threshold
Avoided (peak ~1.9°C)
Long-term stabilisation
 Overall role
Near-term risk reduction + long-term control
Total Gross GHG (MtCO₂e)
Share of Non-CO₂ Gases
Year: 2023 | 20 Year Horizon | 100 Year Horizon | ||
|---|---|---|---|---|
Source | AR 2 | AR 6 | AR 2 | AR 6 |
Gross GHG (MtCO2e) | 237.52 | 259.37 | 207.56 | 212.87 |
Non-CO2 Share | 22.82% | 29.32% | 11.67% | 13.88% |
20 Year Horizon
Gross GHG Emissions (Mt CO 2e)
Non-CO 2 Share
100 Year Horizon
Gross GHG Emissions (Mt CO 2e)
Non-CO 2 Share
20 Year Horizon
Gross GHG Emissions (Mt CO 2e)
Non-CO 2 Share
100 Year Horizon
Gross GHG
Non-CO 2 Share
Categorywise Key Emitting Districts
Animal husbandry, agriculture and waste sectors are key contributors to the methane and nitrous oxide emissions. Key category contributions to the total Non-CO2 emissions of Gujarat and the key emitting districts of each category are illustrated below:


Key Contributor | Mitigation Measure | Developmental Benefits |
|---|---|---|
Diesel vehicles | Vehicle electrification, fleet renewal, BS-VI standards | Cleaner air, reduced health costs, fuel savings |
Brick kilns | Cleaner kiln technologies (zig-zag, VSBK) | Improved worker health, fuel efficiency, compliance |
MSMEs using solid fuels | Fuel switching, improved combustion | Energy efficiency, productivity gains |
Crop residue burning | In-situ residue management, biomass utilisation | Improved soil health, reduced smog episodes |
Open waste burning | Improved waste collection and processing | Cleaner neighbourhoods, reduced disease burden |
Key Contributor | Mitigation Measure | Developmental Benefits |
|---|---|---|
Transport (NOₓ) | Vehicle electrification, emission controls | Improved respiratory health, urban livability |
Industry and power generation | NOₓ and VOC controls | Improved air quality, ecosystem protection |
Biomass and waste burning | Controls on open burning | Reduced crop losses, better public health |
Key Contributor | Mitigation Measure | Developmental Benefits |
|---|---|---|
Room air conditioners | Low-GWP refrigerants, efficient ACs | Lower electricity bills, reduced peak demand |
Refrigeration and cold chains | Efficient systems, refrigerant recovery | Reduced food loss, improved cold-chain reliability |
Industrial cooling | Low-GWP refrigerants, leakage reduction | Energy savings, lower operating costs |